> For the complete documentation index, see [llms.txt](https://docs.ceruleansonar.com/c/llms.txt). Markdown versions of documentation pages are available by appending `.md` to page URLs; this page is available as [Markdown](https://docs.ceruleansonar.com/c/tracker-650/getting-started/expectations.md).

# Expectations

### Introduction

Like any DVL, the Tracker 650 performs best when the vehicle, control system, and environment are well matched to the application. A hard, flat bottom provides the best results, but the sensor can still perform well in less ideal conditions.

In position hold, the ROV will typically wander slowly around a mean location, with less than 1 meter short-term circular error and less than 1 meter/min long-term drift. Actual performance depends on control tuning, bottom type, vegetation cover, standoff height, and other environmental factors.

### Data

The graphs below show data from a 435 meter lake course. The sensor was mounted on a BlueROV2 in orientation-hold mode and operated about 0.5 m below the surface while the vehicle was towed by a boat at a relatively constant speed. Because the tether was attached to the rear port side, the ROV was pulled backward with an angular offset of about 20°.

The test began and ended in shallower vegetated areas. In general, altitudes below 6.5 m correspond to vegetation, while altitudes above 6.5 m correspond to muck bottom. All graphs below are from this same test.

{% hint style="info" %}
Note: on this test day we were able to continue out to water of about 22 meters deep with similar results. That data not shown here.
{% endhint %}

<figure><img src="/files/ogjiH6XUgHAmt0P7doIl" alt=""><figcaption><p>Confidence represents the Tracker 650's estimate of how accurate the instantaneous measurement is. Possible values range from 0 (don't use) to 100 (as confident as possible). The confidence in this test varies from about 50 to 99. The areas of lower confidence generally correspond to areas with heavy vegetation.</p></figcaption></figure>

{% content-ref url="/spaces/ldEroQctKFErSiZvuhJk/pages/vtMbCeXgBTNJHovfM0DW" %}
[Expectations](/c/tracker-650/getting-started/expectations.md)
{% endcontent-ref %}

<figure><img src="/files/ACFxk50HxNMbOHcjZwa5" alt=""><figcaption><p>Standoff represents the altitude of the sensor above the seabed (when the sensor is mounted in the default orientation of pointing down). The shallower areas generally have lower confidence in this test due to vegetation on the seabed.</p></figcaption></figure>

<figure><img src="/files/BNwvnPjG8GkTeElM0QKj" alt=""><figcaption><p>Delta X is the distance the sensor moved along the sensor X axis in the previous sample period. Deltas are also available for the Y and Z axes. In this case all samples are 0.2 seconds long. The Delta X position started around -0.1 meters per sample and decreased to -0.04 meters per sample at the end. Although this looks noisy (and it is), see the next chart.</p></figcaption></figure>

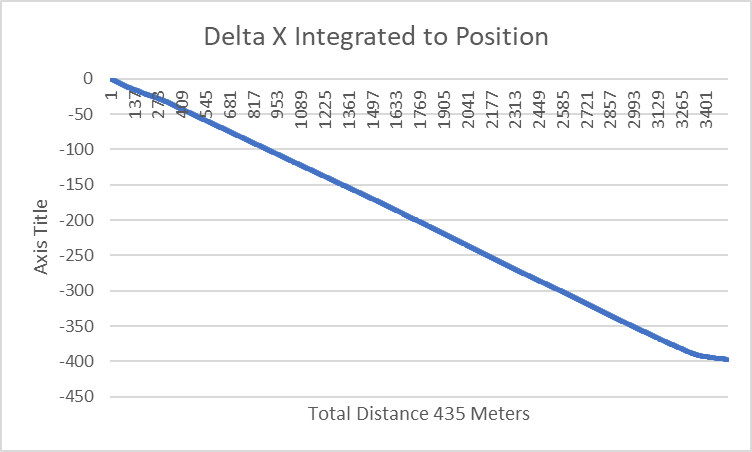
<figure><img src="/files/1mItT7Et0sa4eBJGmtoR" alt=""><figcaption><p>The ROV essentially integrates delta position into position. The total displacement in X is 398 meters over the 435 test course. The reason it is not the length of the test course is due to the rotation of the ROV which causes some of the displacement to show up in delta Y. The ROV's dead-reckoning function agreed exactly with the GPS ground-truth for this test.</p></figcaption></figure>